Your customers click color swatches every day. Blue gets 300 clicks. Red gets 40. Do you stock more blue or keep ordering equal quantities of both? Without data, you are guessing.
Rubik Combined Listings fires a JavaScript event called rcl_swatch_clicked every time a customer clicks a swatch. The event carries 16 data properties: product ID, title, URL, price, option value, swatch type, and more. You can send this event to Google Analytics 4, Facebook Pixel, or any analytics tool that listens for custom events.
This post covers the event structure, the GA4 integration code, and the practical insights you can pull from swatch click data.
In this post
- The rcl_swatch_clicked event
- All 16 data properties explained
- Sending the event to Google Analytics 4
- Using Google Tag Manager instead
- What to measure with swatch click data
- Actionable insights for your store
- Video walkthrough
- Frequently asked questions
- Related reading
The rcl_swatch_clicked event
Every time a customer clicks a swatch on your storefront (product page or collection page), Rubik dispatches a custom JavaScript event on the document object. The event name is rcl_swatch_clicked.
The event fires automatically. You do not need to enable it or configure anything in the app. It works on every plan, including the free plan. All you need to do is write a small event listener that captures the data and sends it to your analytics platform.
The event carries a detail object with 16 properties. Each property gives you a specific piece of information about what the customer clicked, where they clicked it, and on which device.
All 16 data properties explained
| Property | Type | Description |
|---|---|---|
optionValue | string | The value the customer clicked, e.g., “Navy Blue” or “Large” |
productId | number | The Shopify product ID of the clicked swatch |
productTitle | string | The product title, e.g., “Cotton T-Shirt – Navy” |
productUrl | string | The product URL handle |
productPrice | string | The product price in store currency |
hasPriceRange | boolean | Whether the product has a price range (multiple variants at different prices) |
productAvailable | boolean | Whether the product is in stock |
productCompareAtPrice | string | The compare-at price (original price before discount), if any |
isCurrent | boolean | Whether the clicked swatch is the currently active product |
category | string | The group category/subgroup, if categories are configured |
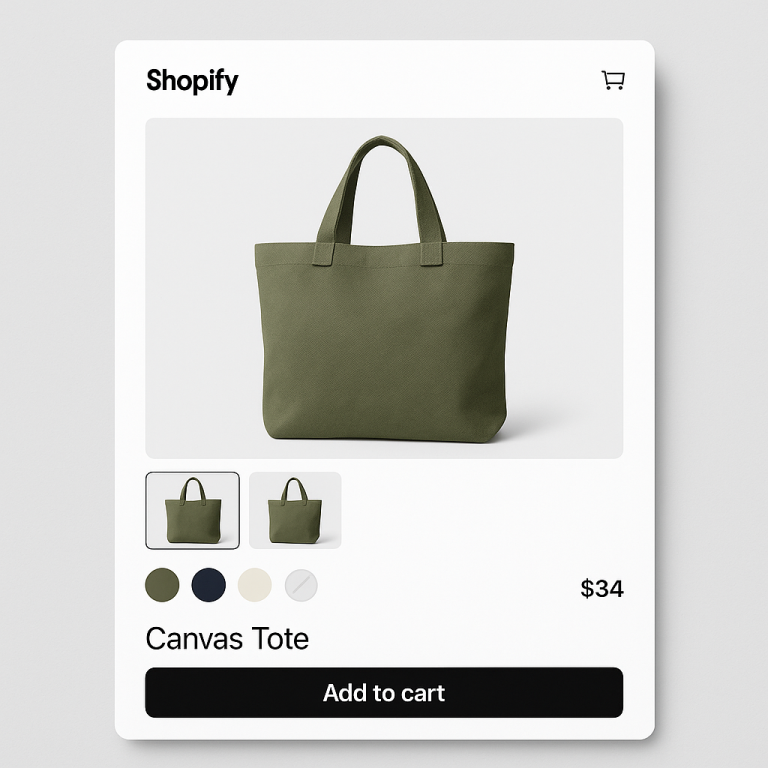
swatchType | string | The swatch display type: “color”, “image”, “button”, or “dropdown” |
context | string | “product” for product page clicks, “collection” for collection page clicks |
viewport | string | The customer’s screen size context: “desktop”, “tablet”, or “mobile” |
position | number | The swatch’s position in the list (1-based index) |
groupOptionName | string | The option name for the group, e.g., “Color” or “Material” |
This gives you enough data to answer questions like: which colors are most popular? Do customers click swatches more on product pages or collection pages? Are mobile shoppers engaging with swatches differently than desktop users? Which swatch positions get the most clicks?
Sending the event to Google Analytics 4
If you have the GA4 tag (gtag.js) installed on your Shopify store, add this JavaScript snippet to your theme’s theme.liquid file, right before the closing </body> tag:
document.addEventListener('rcl_swatch_clicked', function(e) {
  var d = e.detail;
  if (typeof gtag === 'function') {
    gtag('event', 'swatch_click', {
      option_value: d.optionValue,
      product_id: d.productId,
      product_title: d.productTitle,
      product_price: d.productPrice,
      product_available: d.productAvailable,
      swatch_type: d.swatchType,
      context: d.context,
      viewport: d.viewport,
      position: d.position,
      group_option: d.groupOptionName
    });
  }
});
This listener captures every swatch click and sends it to GA4 as a custom event called swatch_click. You do not need to send all 16 properties. The example above sends the 10 most useful ones. Add or remove properties based on what you want to track.
After adding the code, go to your GA4 property. Navigate to Admin > Custom definitions > Custom dimensions. Create a custom dimension for each parameter you want to see in reports (option_value, swatch_type, context, viewport, etc.).
Using Google Tag Manager instead
If you use Google Tag Manager, you can capture the event through the data layer instead of calling gtag directly.
Add this snippet to your theme:
document.addEventListener('rcl_swatch_clicked', function(e) {
  var d = e.detail;
  window.dataLayer = window.dataLayer || [];
  window.dataLayer.push({
    event: 'swatch_click',
    optionValue: d.optionValue,
    productId: d.productId,
    productTitle: d.productTitle,
    productPrice: d.productPrice,
    swatchType: d.swatchType,
    context: d.context,
    viewport: d.viewport,
    position: d.position
  });
});
Then in GTM, create a Custom Event trigger with the event name swatch_click. Create Data Layer Variables for each property. Create a GA4 Event tag that fires on this trigger and sends the variables as event parameters. For more on how swatch analytics connect to conversion rate optimization, see this guide on CraftShift.
What to measure with swatch click data
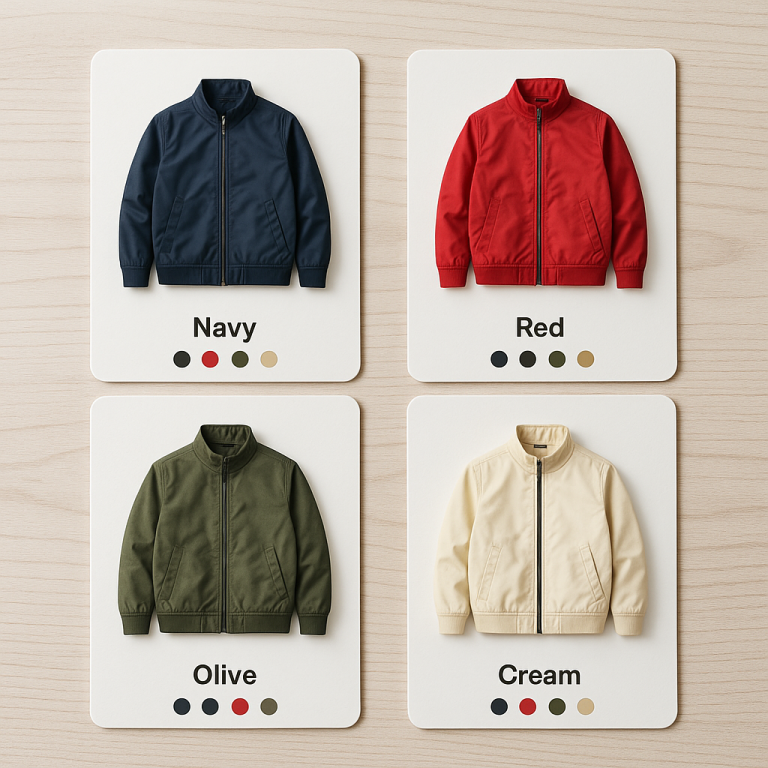
Most clicked colors. Sort swatch clicks by optionValue to see which colors or options get the most engagement. If “Forest Green” gets 5x more clicks than “Burgundy,” that tells you something about demand.
Product page vs collection page clicks. The context property tells you where the click happened. If most swatch clicks come from collection pages, customers are browsing and comparing. If most come from product pages, customers are already interested and exploring options. This affects where you invest in swatch design.
Desktop vs mobile engagement. The viewport property shows whether the click came from desktop, tablet, or mobile. If mobile users click fewer swatches, your swatches might be too small or hard to tap on small screens. The responsive contexts feature lets you adjust swatch sizes per screen size.
Swatch position analysis. The position property tells you which swatch in the row was clicked. If swatches in positions 1-3 get 90% of clicks and positions 4-10 get almost none, customers may not be scrolling through all options. Consider putting your best sellers in the first three positions.
Out-of-stock click patterns. Cross-reference productAvailable with click frequency. If customers frequently click on out-of-stock options, that is demand signal. Consider restocking those products or setting up back-in-stock notifications.
Actionable insights for your store
Inventory planning. Swatch click data shows intent before purchase. A color that gets many clicks but few purchases might have a pricing or availability issue. A color that gets few clicks might need better photography or a different position in the swatch row.
Photography priorities. If “Sage Green” gets the most clicks, invest in better product photos for that color first. Front shots, lifestyle photos, detail shots. Make the most popular option look the best.
Swatch design optimization. Compare click rates between image swatches and color swatches. If products with image swatches get more engagement, switch your remaining products from color circles to image-based swatches. The swatchType property makes this comparison easy.
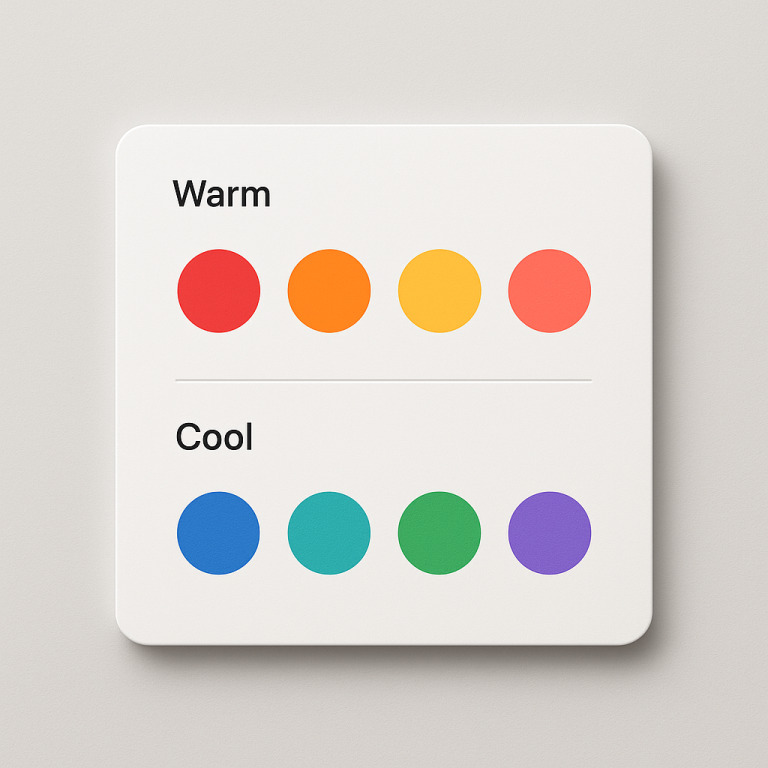
Seasonal trends. Track swatch click data over weeks and months. You may discover that warm colors get more clicks in autumn and cool colors in summer. Time your inventory and promotions accordingly.
Collection page effectiveness. If collection page swatch clicks rarely lead to product page visits, your collection page swatches might not be doing their job. Consider switching from color dots to image swatches on collection pages so customers can see the actual product appearance. Read the combined listings FAQ for more on collection page configuration.
Video walkthrough
See Rubik Combined Listings swatch features in action:
Demo store | Swatch event docs
Frequently asked questions
Does the swatch click event fire automatically?
Yes. Rubik Combined Listings dispatches the rcl_swatch_clicked event on every click without any configuration. You just need to add a listener to capture and send the data to your analytics platform.
How do I see swatch click data in GA4?
Add the JavaScript listener snippet to your theme, then create custom dimensions in GA4 for the event parameters you want to analyze. The events will appear under Events in your GA4 reports. You can build custom explorations to analyze click patterns by color, device, or page type.
What data does the swatch click event include?
16 properties: optionValue, productId, productTitle, productUrl, productPrice, hasPriceRange, productAvailable, productCompareAtPrice, isCurrent, category, swatchType, context, viewport, position, and groupOptionName. You choose which ones to send to your analytics tool.
Is swatch click tracking available on the free plan?
Yes. The event fires on every plan, including free. There is no paid upgrade required for analytics. You just need to add the listener code to your theme.
Can I send swatch click data to tools other than Google Analytics?
Yes. The event is a standard JavaScript CustomEvent. You can listen for it and send data to Facebook Pixel, Mixpanel, Segment, Klaviyo, or any platform that accepts custom events. The listener pattern is the same. Just replace the gtag call with your platform’s tracking function.
Does firing analytics events slow down swatch clicks?
No. The event fires asynchronously after the swatch click is processed. The customer’s experience (page navigation, image swap) happens first. The analytics call runs in the background and does not delay anything the customer sees.